|
Antimicrobial susceptibility testing using disc diffusion methods, D. |
|
|
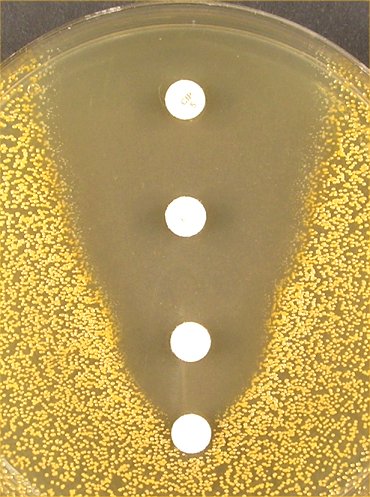
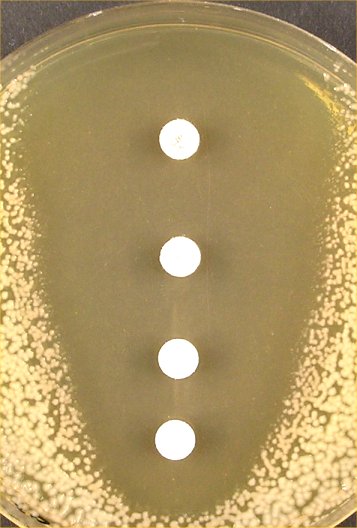
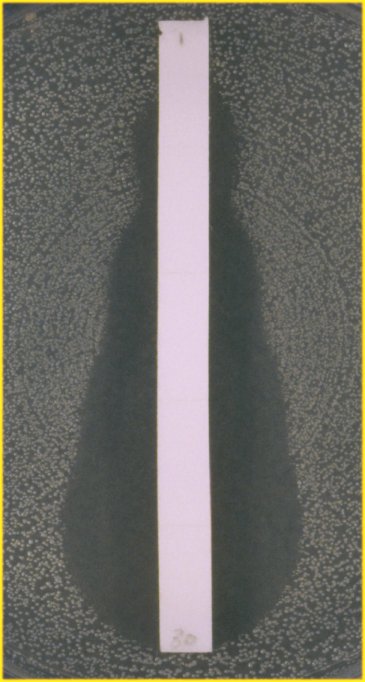
M-test The SRA equation can be modified in a way which will permit the calculation of MIC-values for individual isolates, the so called M-test. This is due to the fact that the inhibition zone size extrapolated to zero gives a concentration value from the regression line which corresponds to the 'critical concentration' of the isolate. The principle has been described also by others, first by Shannon et al. in 1975, who determined the penicillin susceptibility of gonococcal isolates using manual, graphic plots. Drugeon et al. in 1987 determined the 'critical concentration' of cefotaxime and ceftriaxone for 91 bacterial isolates. In 1994 Delignette-Muller and Flandrois described the ICD, Inhibitory Concentration in Diffusion, determined for three aminoglycosides in 70 isolates using the same principle. In all these methods a series of different concentrations of the antibiotic in diffusion sources, usually paper discs, is applied. The inhibition measurements are then used to solve the equation and to calculate the 'critical concentration', or Q-zero, at zone zero. In the M-test equation the MIC value is obtained by multiplying the Q-zero value with a conversion factor. This factor is often 2, but can vary with drug and bug. The M-test has also been used successfully for fluconazole and voriconazole susceptibility testing of Candida species. Let us now return to inhibition zone diameter histograms. The disc method is the most common test for antimicrobial susceptibility and such results are available all over the world. How can this untapped source of susceptibility results be used for surveillance? Well, there is a method to obtain an internal calibration for comparative purposes, so called normalized resistance interpretation, NRI (see next page). NEXT
|
|